- >News
- >Want to Predict Bitcoin Prices? Follow the Stock Market
Want to Predict Bitcoin Prices? Follow the Stock Market
The cryptocurrency market has taken a dive recently, with the bitcoin price falling from $12,000 on September 1 to $10,000 on September 8. The stock market is also down from recent highs, after the S&P 500 fell by 5% over the same period, and the NASDAQ Composite fell by 8%.
While analysts had long regarded the price of bitcoin as uncorrelated with the stock market, things have changed significantly in recent months. It now seems that the crypto market moves up when the stock market rises, and that it moves down when the stock market falls.
This means that if you want a better idea of where bitcoin prices are going, you should really watch the stock market for signals. We turn to macroeconomics to explain why this is the case, and we also explain for how long you should expect this correlation to last.
Bitcoin Prices Increasingly Correlated With S&P 500
According to data from London-based analysts skew, bitcoin’s correlation with the S&P 500 has spiked in recent days, weeks and months.
Its one-month correlation with the S&P 500 hit 63.9% on September 3, as both the price of bitcoin and the index were falling.
Source: skew
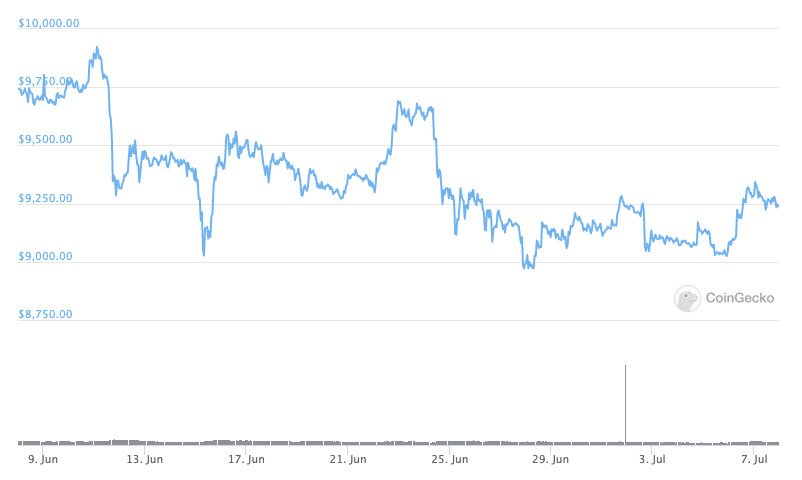
The one-month correlation also hit a record high of 78.8% on July 8. The month leading up to this date saw bitcoin fall from $9,742 to $9,326 (on June 12), rise to $9,678 (on June 23), fall to $9,000 (on June 28), and then rise to $9,250 (on July 8).
Source: CoinGecko
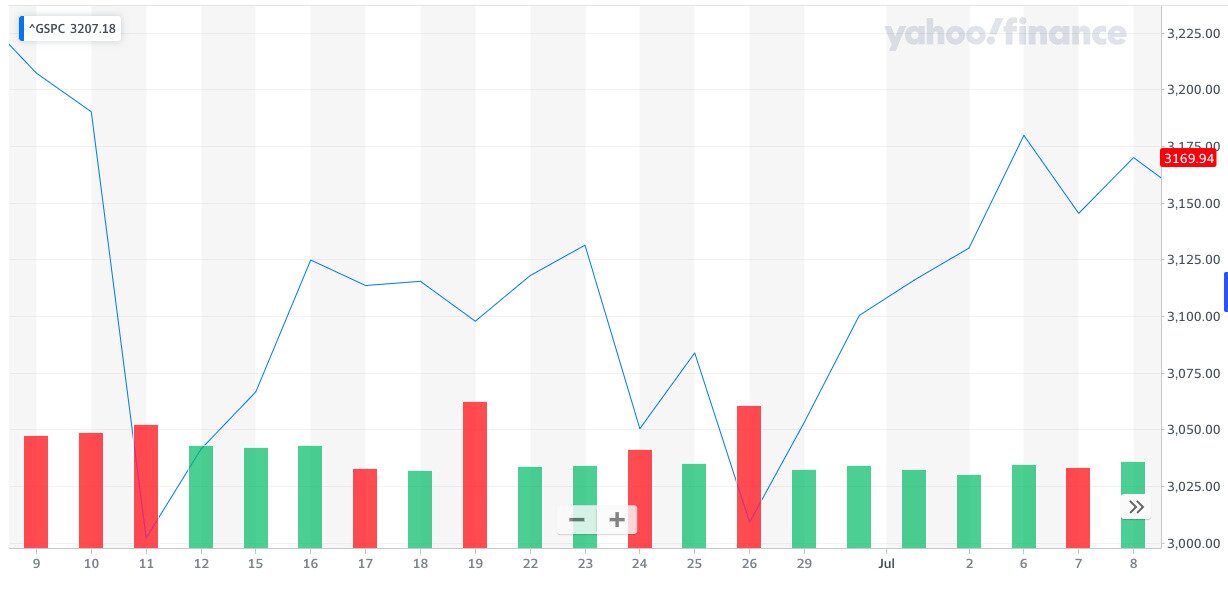
As for the S&P 500, it started this month-long period at $3,200, then fell to $3,000 (on June 11), then rose to $3,131 (on June 23), then fell to $3,000 again (on June 26), and then rose to $3,169 (on July 8).
Source: Yahoo! Finance
Because the bitcoin price and S&P 500 moved up and down at basically the same time (remember that dates won’t be exactly identical due to the stock market closing for weekends), the one-month correlation hit its highest ever level since skew began collecting data in April 2018.
The level has remained high ever since. In fact, its general trend has been to gradually rise since it moved out of negative territory on April 6 (when it was -4.9%). This is reflected in the 12-month correlation between bitcoin and the S&P 500.
As the skew chart above indicates, the 12-month correlation had always been either negative or 0%. This changed on May 13, when it jumped from -14.9% to 32.1% overnight.
And since jumping to 32.1% there has been an incremental climb upwards, with the 12-month correlation standing at 44.1%, as of writing.
What does this mean? Well, while this will only ever remain an informal rule of thumb, it means that investors may benefit from viewing stock market movements as signals on when to buy or sell bitcoin and crypto.
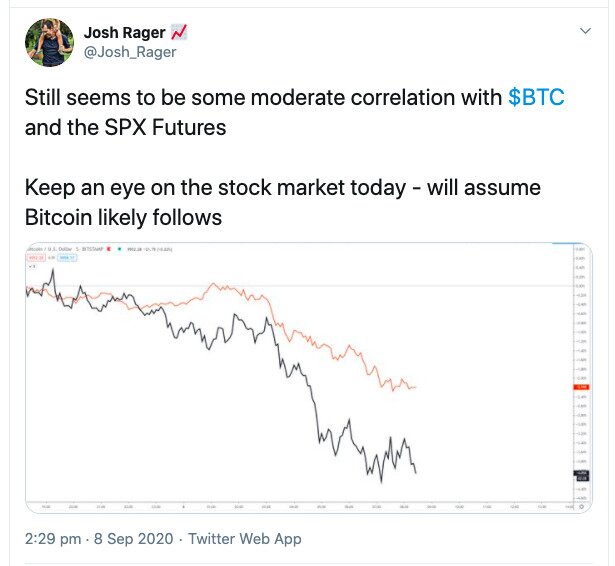
Crypto trader and analyst Josh Rager advises his followers to watch the stock market. Source: Twitter
Why Correlation Has Increased
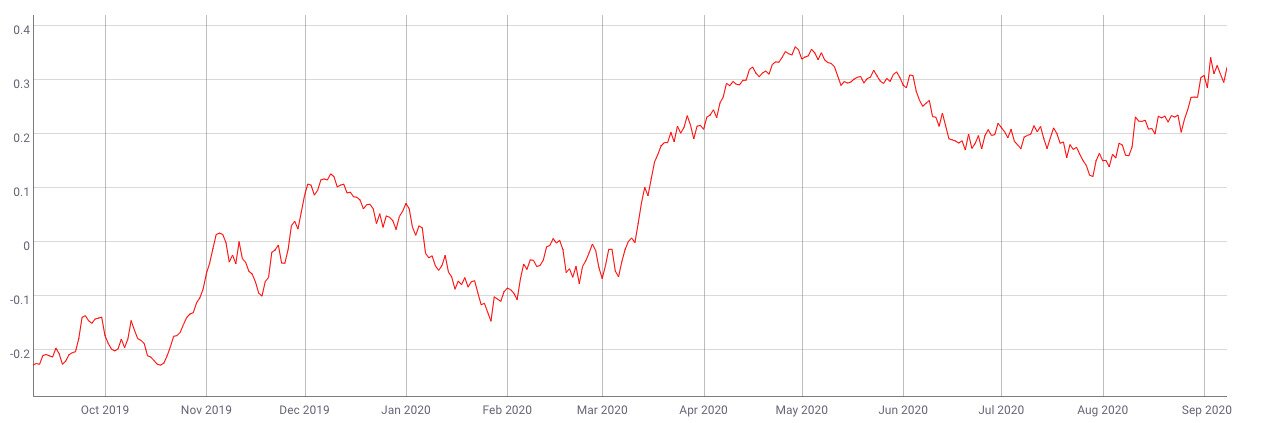
Skew isn’t the only source of data analytics to confirm that the bitcoin-S&P 500 correlation has been rising. Coin Metrics’ data on the 90-day correlation level has also shown a general upwards trend in recent months:
Source: Coin Metrics
Why has this upwards trend happened? The clue comes from the period when the correlation was at a yearly low, in March. This was when the cryptocurrency market — and the stock market — suffered a massive crash, caused by the coronavirus pandemic and the resulting economic fallout.
Central banks around the world — and particularly in the United States — responded to this drop by beginning massive rounds of quantitative easing. They also slashed interest rates to near-zero, in order to stimulate spending and keep the economy ticking along.
This had the effect of supercharging stock markets. Trillions were being pumped into the global economy via asset purchases, with low interest rates and stagnant economic activity providing the receiving institutions with few options to spend these trillions profitably. So they went and bought masses of stocks, explaining why the S&P 500 and NASDAQ perversely hit all-time highs during a big recession.
This money also likely went to bitcoin, since crypto is another speculative area that, like the stock market, promises high returns. That QE money did end up in crypto is supported by the increase in institutional investment we’ve witnessed in recent months.
This explains the correlation: increasingly, the same people are investing in stocks and crypto. So when they get cold feet and feel the need to “take profits,” they take profits from their stocks and their bitcoin.
The crypto-stock market correlation is further reinforced in one other way by recent quantitative easing. By flooding the economy with QE money, the Federal Reserve, for example, is inadvertently weakening the US dollar. This is making gold and capped cryptocurrencies such as bitcoin more attractive, in addition to high-return stocks.
The Future
As such, we can expect to see a significant positive correlation between stocks and crypto for as long as the present economic environment continues. With low interest rates, high quantitative easing, and a struggling wider economy, there’s little else for investors to do other than put their money with (tech) stocks and crypto.
This would imply that when the economy finally returns to ‘normal’ (whenever that may be), the correlation between the bitcoin price and the stock market will weaken. Investors will be less willing to put their money with speculative assets such as bitcoin, given that higher interest rates and an increase in profit-making companies will give them other, less risky options.
Of course, this may not necessarily happen. Assuming that crypto does convert a sizable number of mainstream investors during this uncertain period, it may continue being correlated with the stock market for some time to come.


