- >News
- >Data Reveals Bitcoin Price, Market Stabilizing At Higher Level
Data Reveals Bitcoin Price, Market Stabilizing At Higher Level
As the price of bitcoin returns to the $19,000+ region, data from a variety of sources reveals that its market is stabilizing at a higher level, reducing the likelihood of significant corrections or crashes.
Metrics concerning volatility, BTC flows, futures premiums, and trading times all indicate a cooling off and normalization of the bitcoin market. The market is now experiencing reduced selling pressure, making it better placed to grow amid incoming institutional investment in bitcoin.
In other words, the above indicators are further proof that 2020’s rally is markedly different in kind from 2017’s, and that the market has indeed consolidated around a bitcoin price in the $18,000 to $19,500 range, at least until demand rises yet again.
Volatility Points to Narrowing of Downside for Bitcoin Price
Perhaps the most revealing and important metric for the current bull market is that bitcoin’s volatility has remained relatively low (in historical terms), even though the cryptocurrency has ballooned from around $10,500 to an all-time high of $19,860 in just over a month.
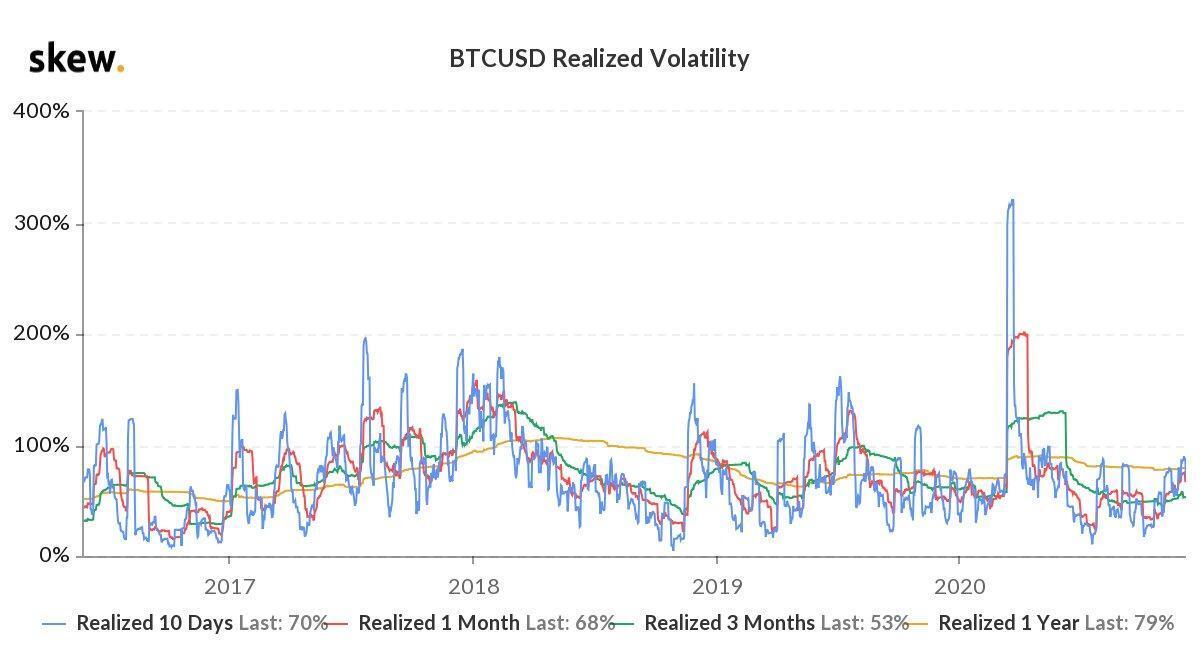
As London-based analytics firm Skew tweeted on December 8, this year’s rally can be described as “quiet,” given that volatility is still below levels witnessed in 2017, 2018, 2019 and March 2020 (when bitcoin crashed along with the stock market).
Source: Twitter/skew
As the chart above illustrates, all timeframes for realized (i.e. actual) volatility are below peaks seen in previous years, indicating that there has been little downside to bitcoin’s recent movements. This bodes well for the possibility of sustaining the latest bull market and consolidating at a higher level for the long-term.
Selling Pressure and Funding Rates
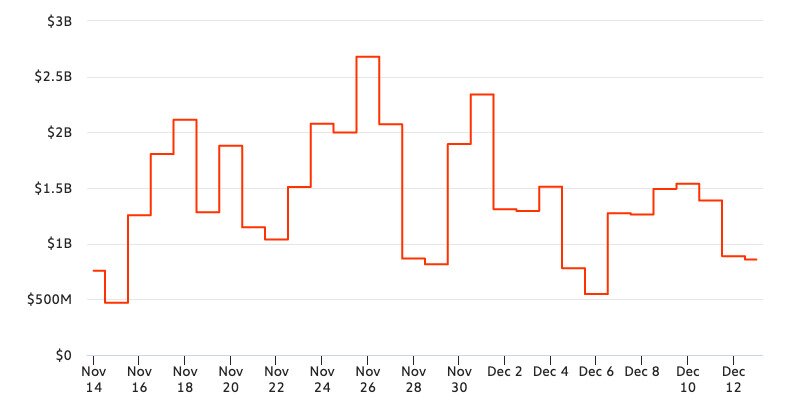
Given that volatility has been relatively low despite bitcoin almost doubling in price in a couple of months, this means that comparatively little selling has taken place. This assumption is backed up by the latest data concerning inflows to exchanges, which tend to increase when bitcoin holders are preparing to sell.
As the below graph from Chainalysis reveals, inflows have declined from a peak of around $2.68 billion on November 26 to $857.5 million as of December 13.
Source: Chainalysis
Put simply, there has been a decline in selling pressure, with increasing numbers of traders expecting the bitcoin price to either hold steady or rise.
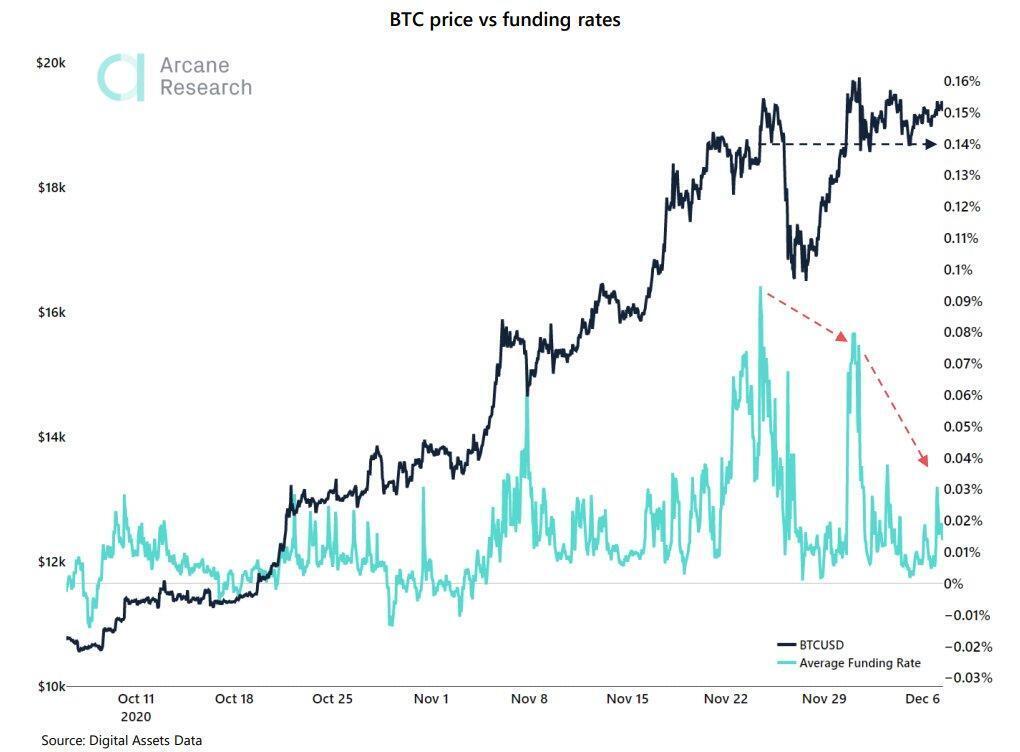
Again, this picture is fleshed out further by another piece of data: futures premiums and funding rates, which have shown a decline.
Source: Twitter/Arcane Research
A decline in funding rates essentially means that the market is cooling down. If rates are significantly above 0% (e.g. 0.10%) this means that investors taking out futures contracts are increasingly going long, while if they are below 0% (as they were at the end of October/start of November) this means that futures contracts are net short.
Basically, a convergence towards average funding rates of 0% means that the market is neither overly bullish nor overly bearish. This is good for bitcoin over the longer term, since it indicates not only that the latest price isn’t being sustained by some kind of short-term mania or bubble, but also that the market doesn’t expect the price to decline (which is what would be indicated if the funding rate were negative).
There’s a good reason why the market is behaving more consistently and moderately this time around: the rally is increasingly being driven by institutions.
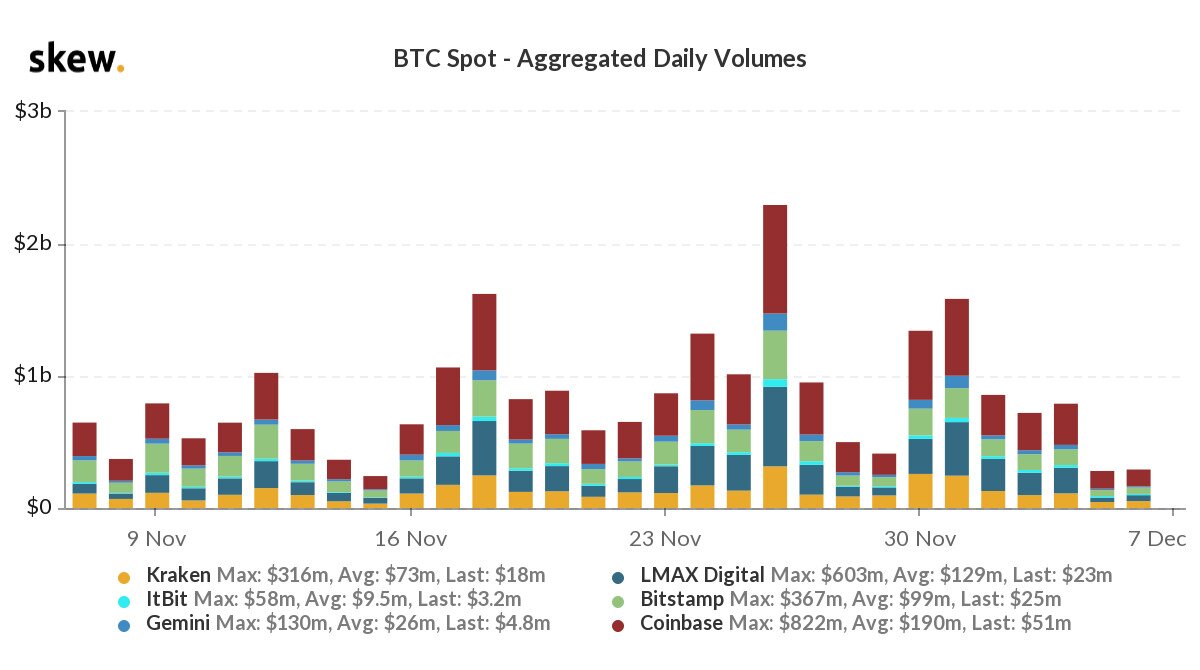
This view isn’t supported only by recent anecdotal evidence and news, but also by trading data, which indicates a decline in trading at weekends, precisely the time when institutional traders are having some much needed time off.
Source: Twitter/skew
Notice the last two dates on this chart, December 5 and 6. These were a Saturday and Sunday, respectively, and they show a marked drop off in daily trading volumes. The same goes for November 28 and 29, for November 21 and 22, November 14 and 15, and November 7 and 8.
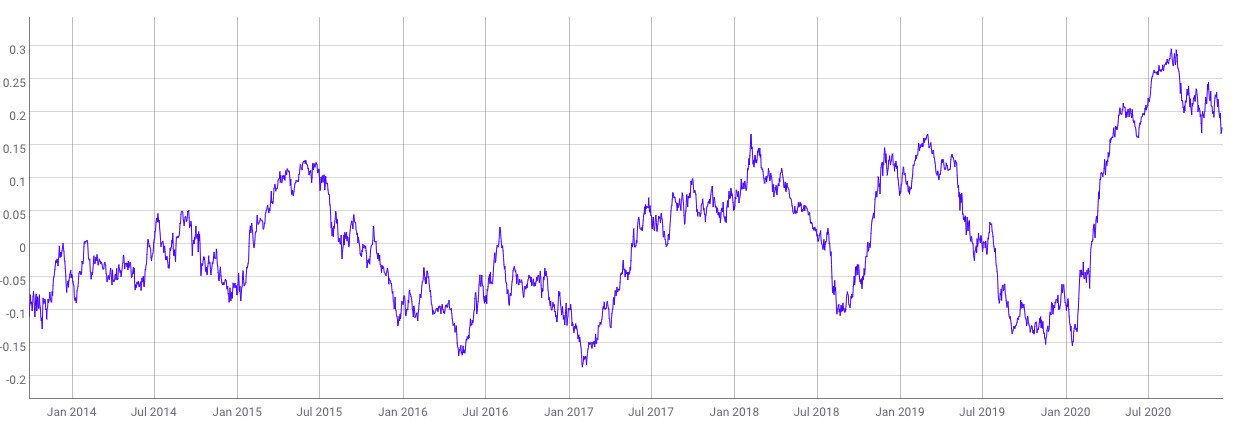
This may seem like an innocuous detail, but it shows that bitcoin is increasingly behaving like the ‘traditional’ stock market, being driven more and more by institutional investors, who are increasingly comprising a bigger proportion of the overall market. This is also indicated by the correlation of bitcoin’s price with the S&P 500, which has been hitting new all-time highs ever since the middle of April.
Source: CoinMetrics
Bitcoin Is Becoming A More Stable Coin
Many analysts and traders have already gone on record as saying that 2020’s rally is ‘different this time,’ but the above data shows that it really is. Yes, we can’t entirely rule out the possibility that bitcoin will suffer some kind of correction, but a wide variety of metrics reveal that the bitcoin market is now more stable than it has ever been.
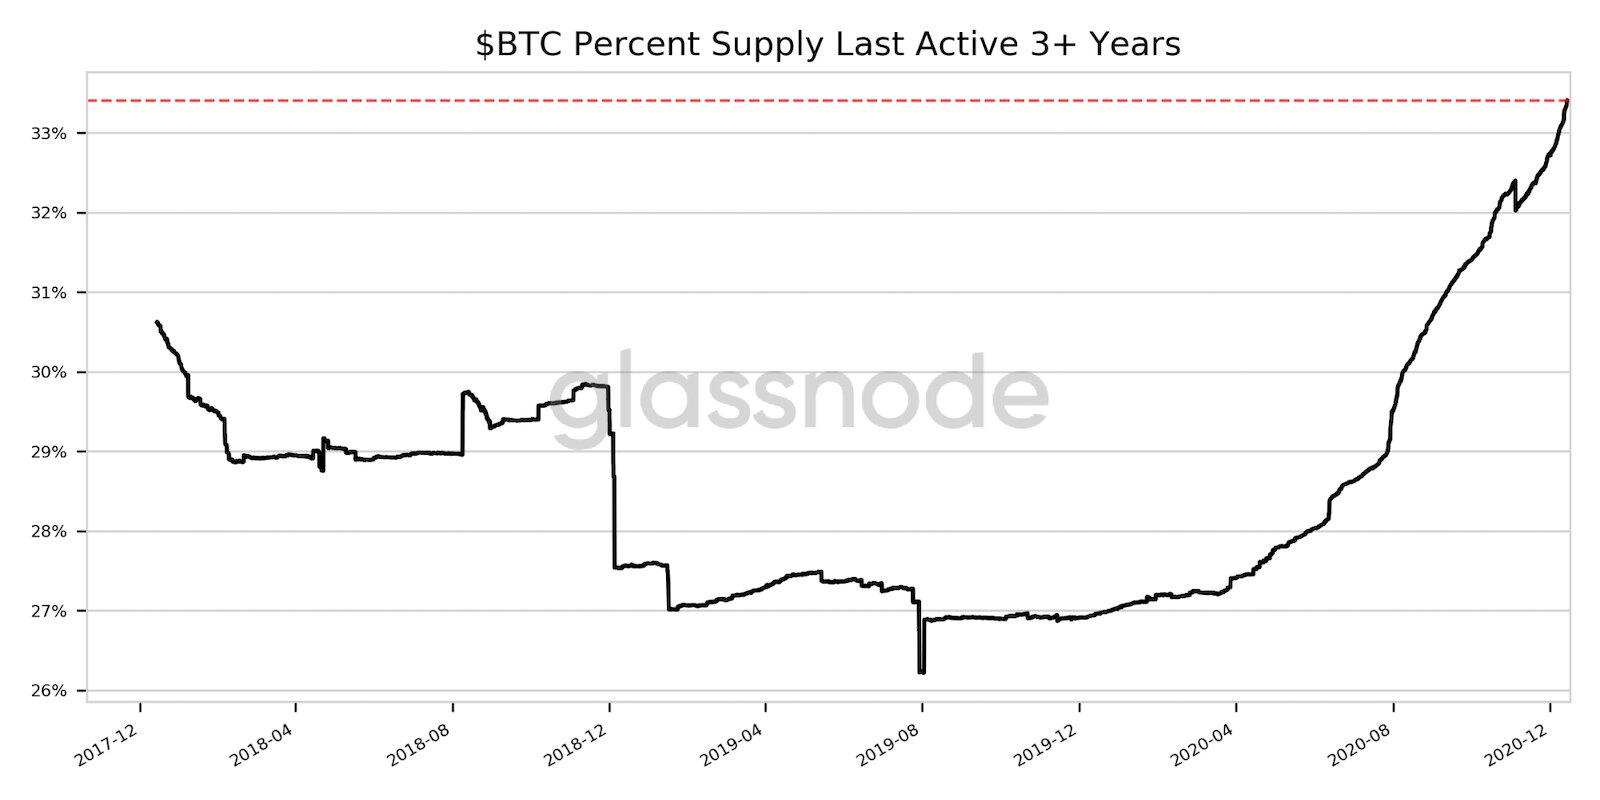
Another revealing piece of info is the percentage of overall bitcoin supply that hasn’t been traded or transacted for at least three years. According to glassnode, this percentage hit an all-time high on December 14, reaching 33.406%. As the table below shows, this figure has risen steeply in 2020.
Source: Twitter/glassnode
When you combine such information with the ongoing news of increasing institutional investment in bitcoin — MassMutual — it becomes difficult to shake the suspicion that the bitcoin price will continue appreciating over the medium- to long-term. The bitcoin market has stabilized and consolidated around the $19,000 level, and now it’s well-placed to build on this foundation and incrementally leapfrog from one plateau to another.
